
Introduction
Lending is one of the biggest DeFi categories by TVL: $13.45 billion in June 2023. Leading protocols like Aave and Compound have loan volumes numbering in billions of dollars. Users are attracted by the possibility to borrow money without any documents or credit checks — in fact, you don’t even have to disclose your name.
However, this pseudoanonymity has a flip side: overcollateralization. On most platforms, a user has to deposit at least $150 in collateral (ETH, for example) to borrow $100 of USDT. If the borrower can’t repay, the collateral is liquidated and the lender gets their money back.
Overcollateralization is hardly capital-efficient and can even slow down the growth of lending in Web3. As an alternative, some DeFi protocols already offer undercollateralized loans, where the loan-to-value (LTV) ratio is bigger than 1. This can attract a lot of fresh capital into the market, but it also gives rise to a new problem: how do we evaluate and minimize the risks?
In this article I’d like to describe an innovative credit scoring model for undercollateralized on-chain loans using machine learning (ML). It is already being used by RociFi Labs, a decentralized platform for capital-efficient undercollateralized loans. In this post, I will describe the difficulties I had to overcome in the process — and discuss if AI scoring can become the standard in decentralized lending.
I designed the model as part of my work for RociFi Labs. The NDA prevents me from disclosing detailed information about the model architecture, datasets, and parameter calculations. However, if you’re interested in developing a similar project, feel free to reach out to me.
Credit scoring in TradFi
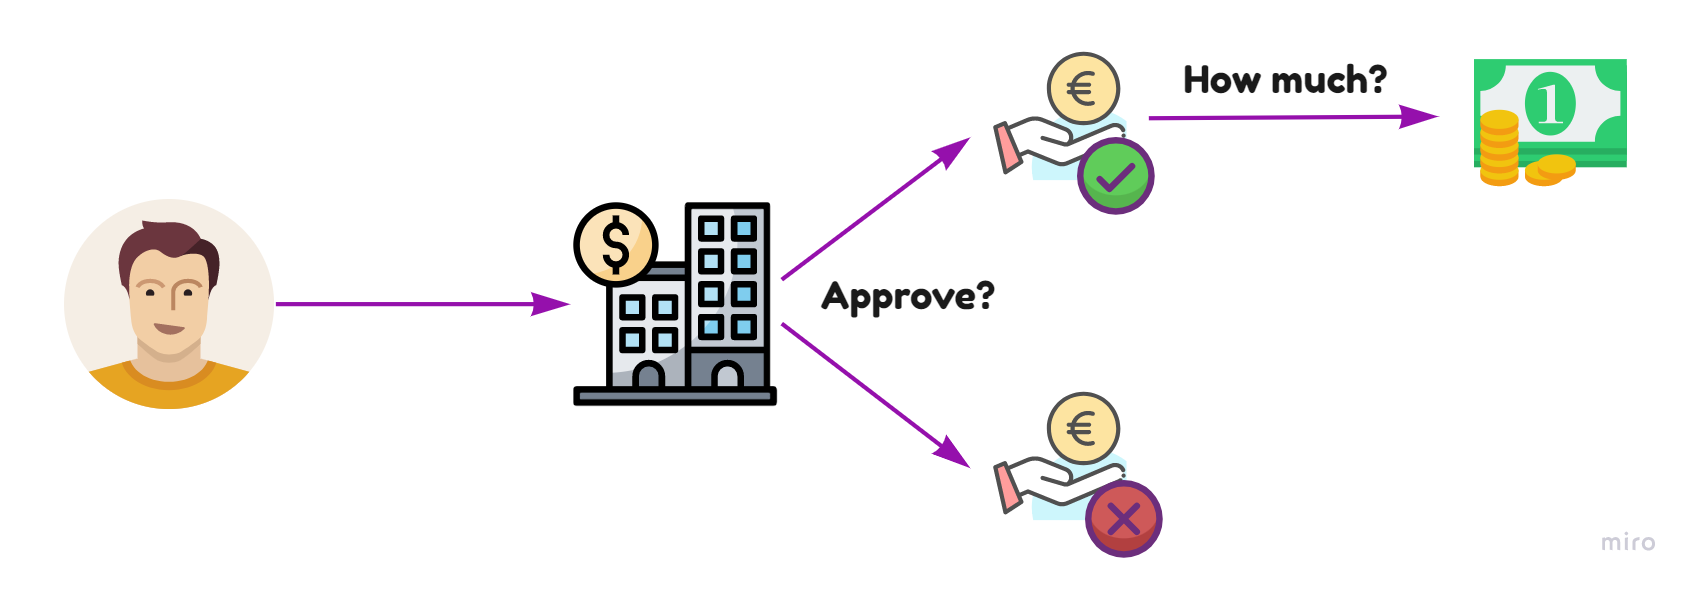
Using machine learning models for credit scoring has already become standard practice for banks when deciding if to issue a loan. An ML model analyzes customer data like salary, savings, family status, etc. — then decides if the customer will be able to repay and how large the loan can be.
For instance, a graduate with one year of work experience will have a very different score from a seasoned professional who has been working for the same company for five years. The diagram illustrates TradFi approach:
Blockchain scoring: technology and business logic difficulties
We have seen that banks both possess personalized financial information about their customers and use human professionals to validate the outputs of AI models calculated based on this information. Unfortunately, blockchain makes things much more complicated.
- Undercollateralized DeFi loans are high-risk by default, so a lender needs to have at least some idea of a borrower’s ability to repay. Unfortunately, blockchain protocols know nothing about the lender’s financials, professions, or even name. It’s not easy to generate a customer profile for scoring using only their wallet transactions — but you’ll be surprised to learn how much we can learn from on-chain activity. 🙂
- DeFi ideology is based on trustless smart contracts rather than human intervention. We can’t waste time on model validation by human specialists the way banks do. Therefore, we have to test any scoring model very carefully, since it’s that model that will make the final decision.
- The bot problem. DeFi is full of speculators who are interested in quick profit and not in products. They generate hundreds of wallets (multiple accounts) and artificially inflate their transaction volumes to maximize the chances to get an airdrop or other rewards. This applies to lending protocols, too: you can easily create 1,000 bots that will generate a successful borrowing history in a couple of days.
🤔 Building a solution
Data gathering algorithm
You can’t find out the age or gender of a blockchain user, their country of residence, or their name. But you can track their wallet: its creation data, transaction volume, earlier loans, repayment stats, etc. You can also identify linked wallets that the person uses for various purposes or on different chains.
A short intro into blockchain transactions: if you know how blockchain works, feel free to skip this part.
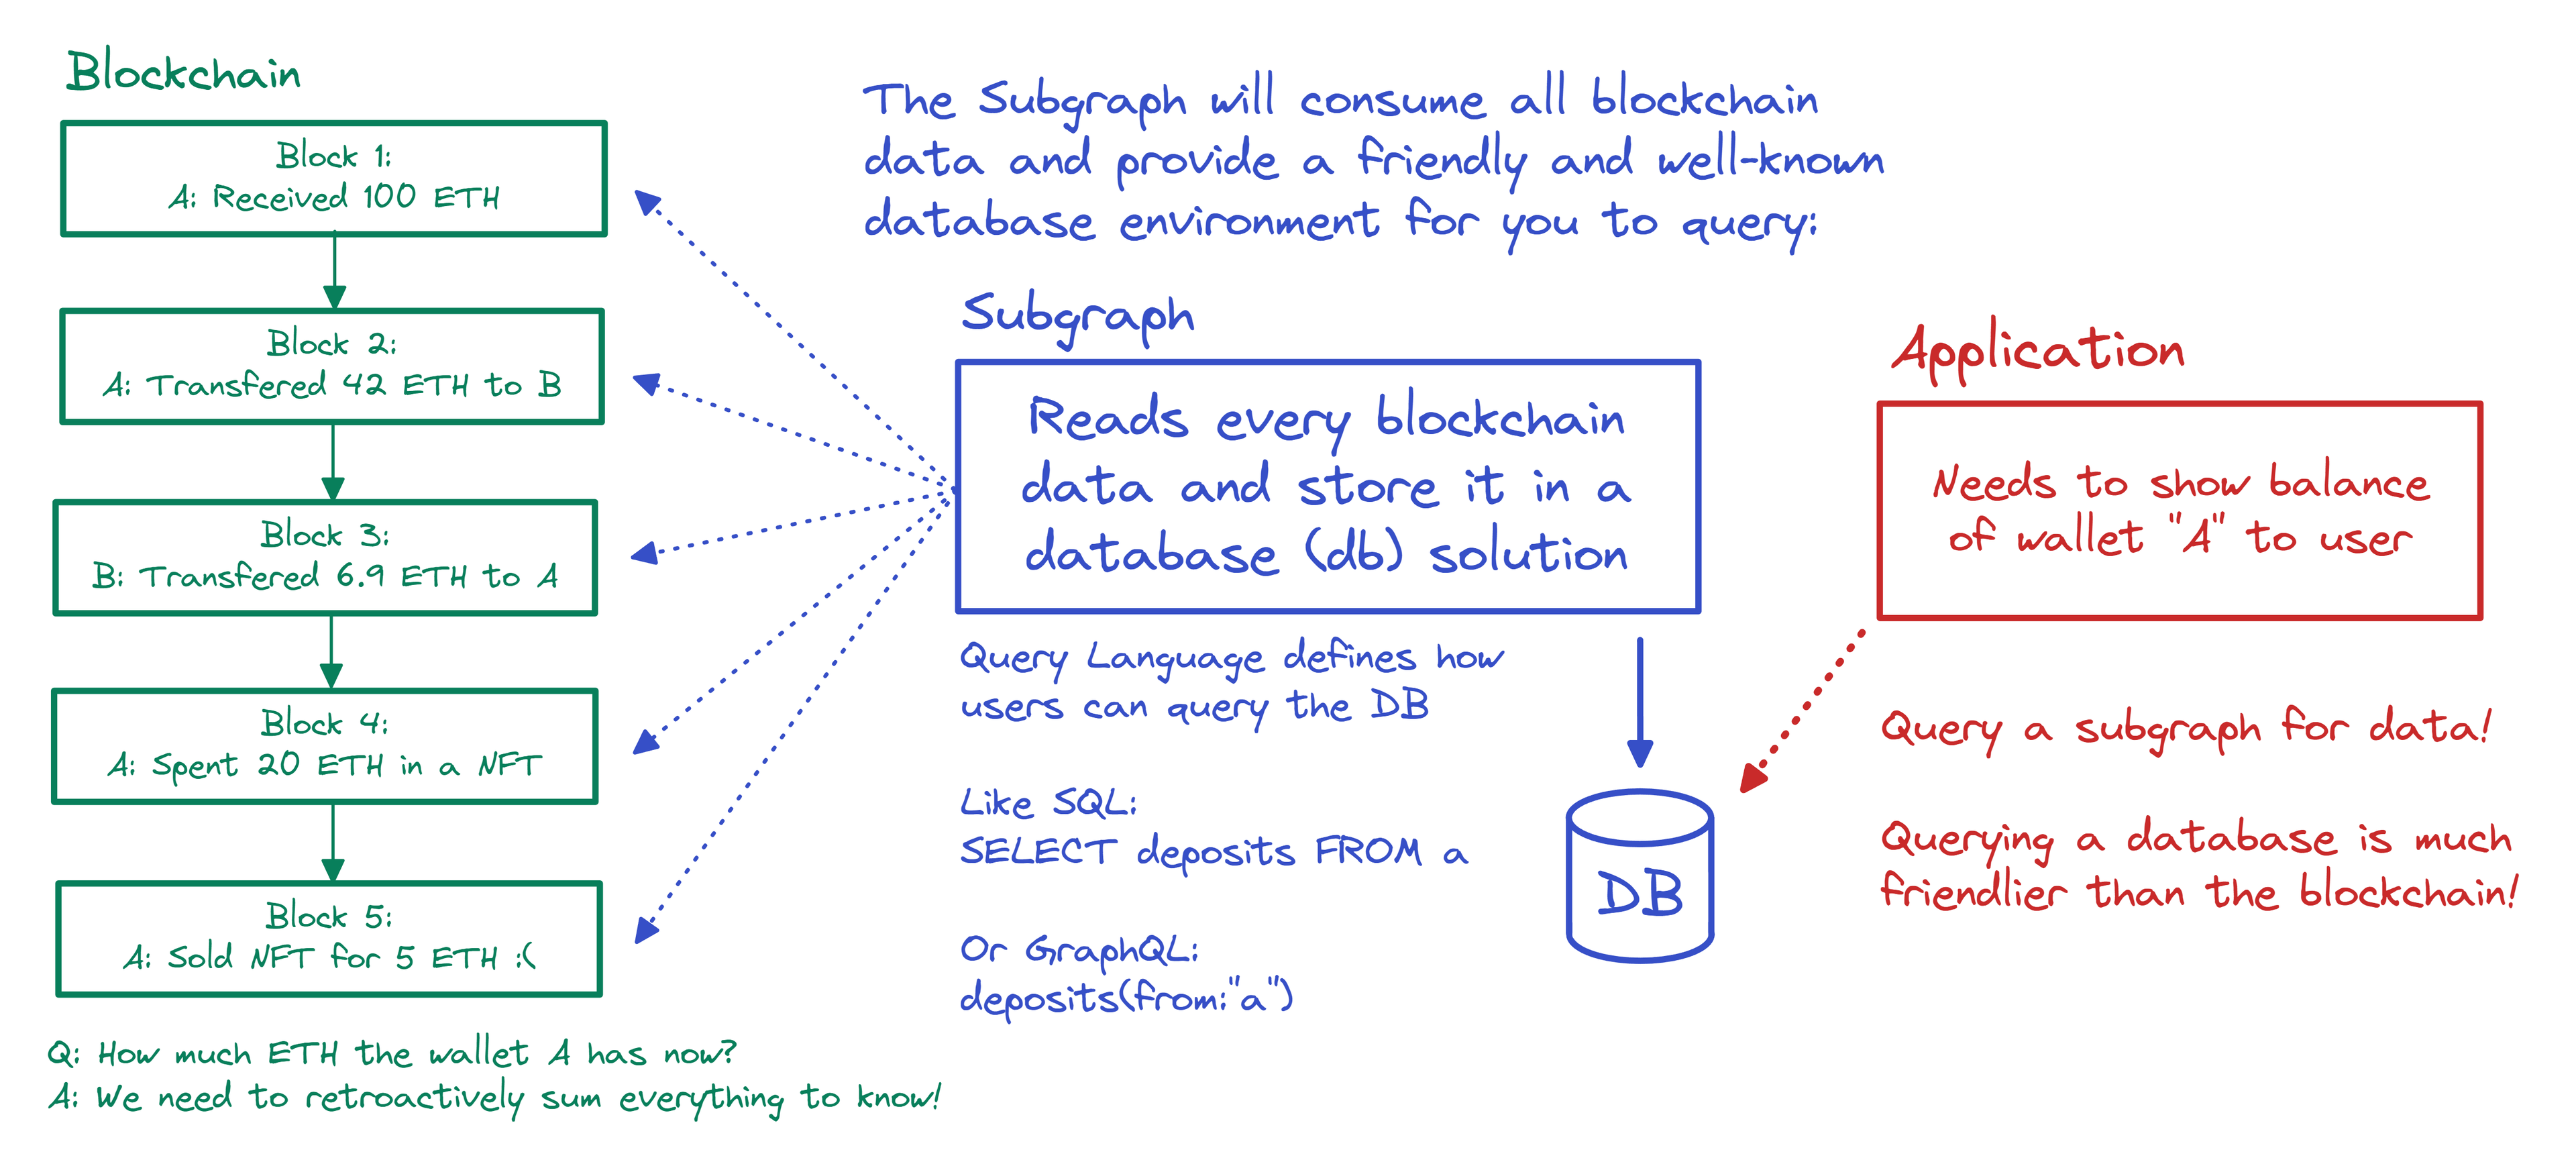
Every wallet transaction, be it sending tokens or minting an NFT, is recorded on the blockchain as a transaction. It includes the addresses of the sender and the receiver, amount, token contract address, etc. A single complex interaction with a dApp can include several transactions. They can be analyzed using The Graph, a protocol that uses the query language GraphQL and provides a handy API.
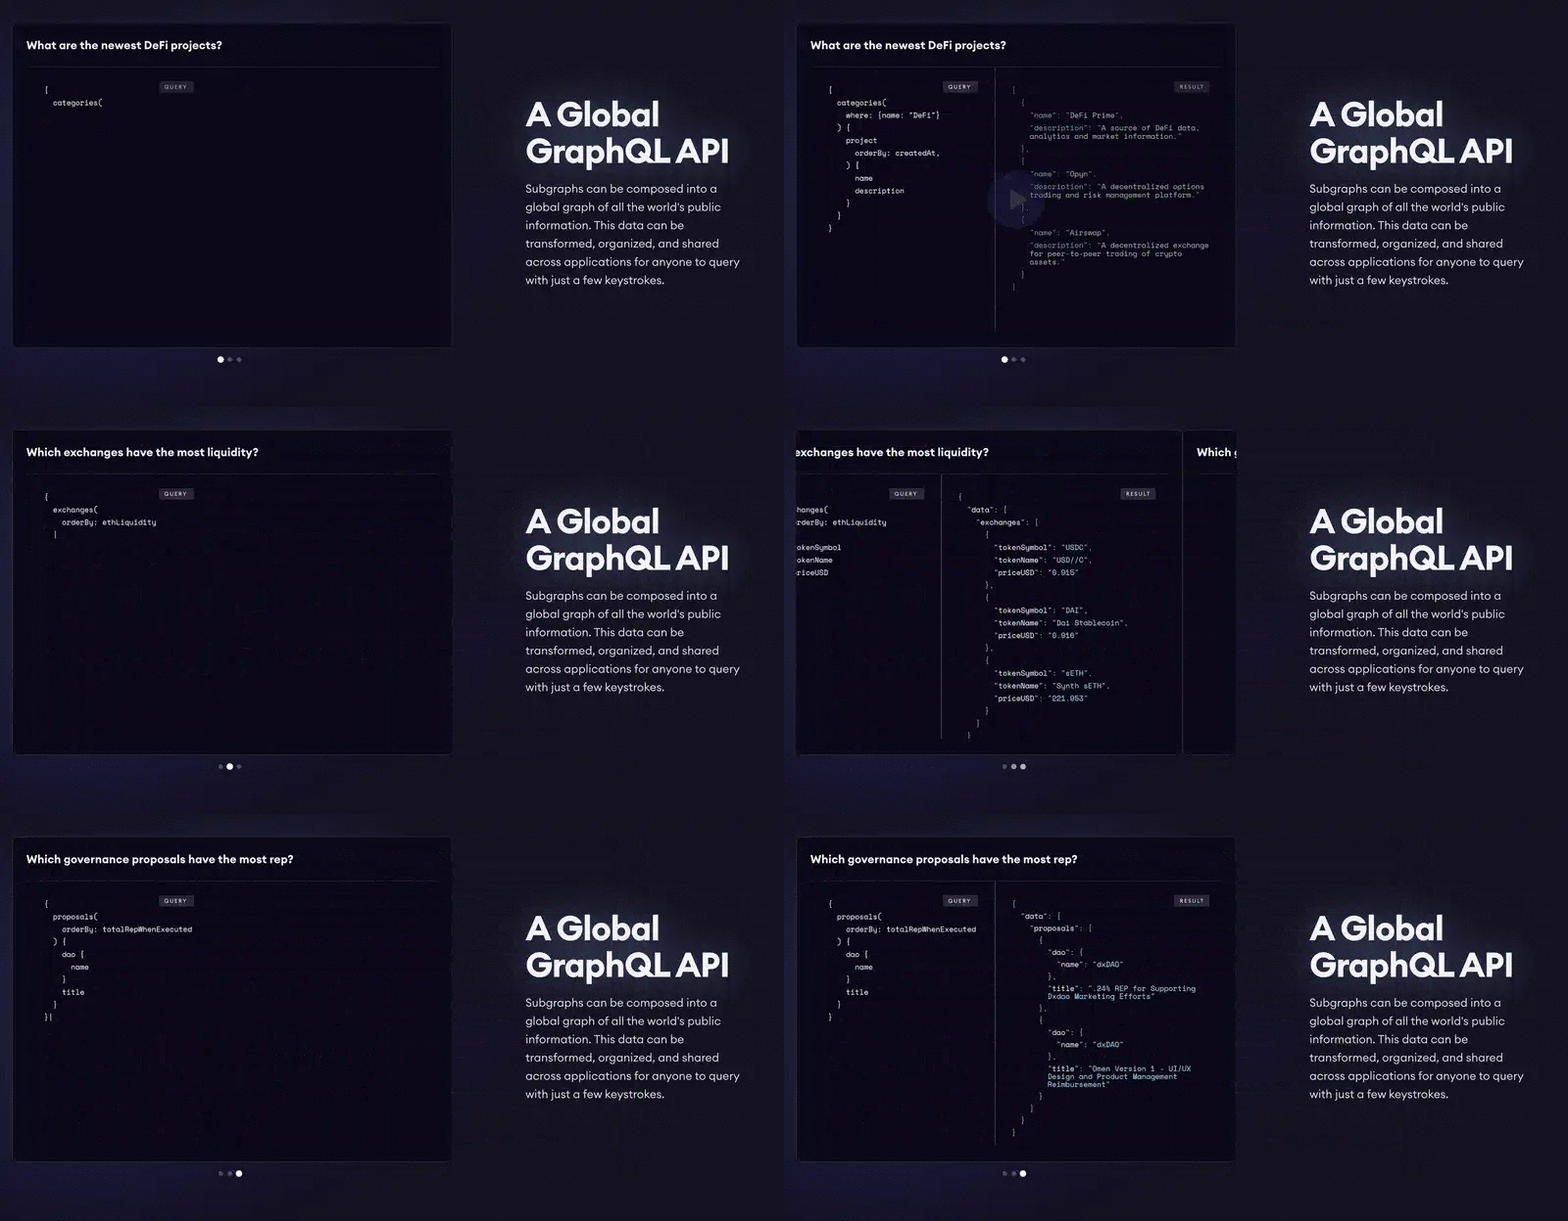
Here you can experiment for queries to the Aave lending protocol — for example, you can find out who borrowed crypto, when, and how much. For an in-depth explanation, check the guide and the documentation.
Another useful source is Dune Analytics. For example, you can build a chart for transaction numbers on various blockchains for a set period.

The data used for the ML model
- Full transaction history for the largest lending protocols: Aave, Compound, Cream, RociFi Labs, Venus, MakerDAO, GMX, Radiant;
- Transaction history on 7 chains: Ethereum, Arbitrum, Fantom, Polygon, Optimism, BSC, Avalanche;
- Historical token prices for conversion to USDT;
- Wallet transactions related to DeFi lending;
- Liquidations: their frequency can be a red flag and point to high appetite for risk;
- Collateralization ratio: the higher, the less prone to speculative risk a borrower is;
- First DeFi interaction date (indicates experience);
- Overall wallet history;
- Market context: if a user borrowed funds during periods of high volatility and uncertainty;
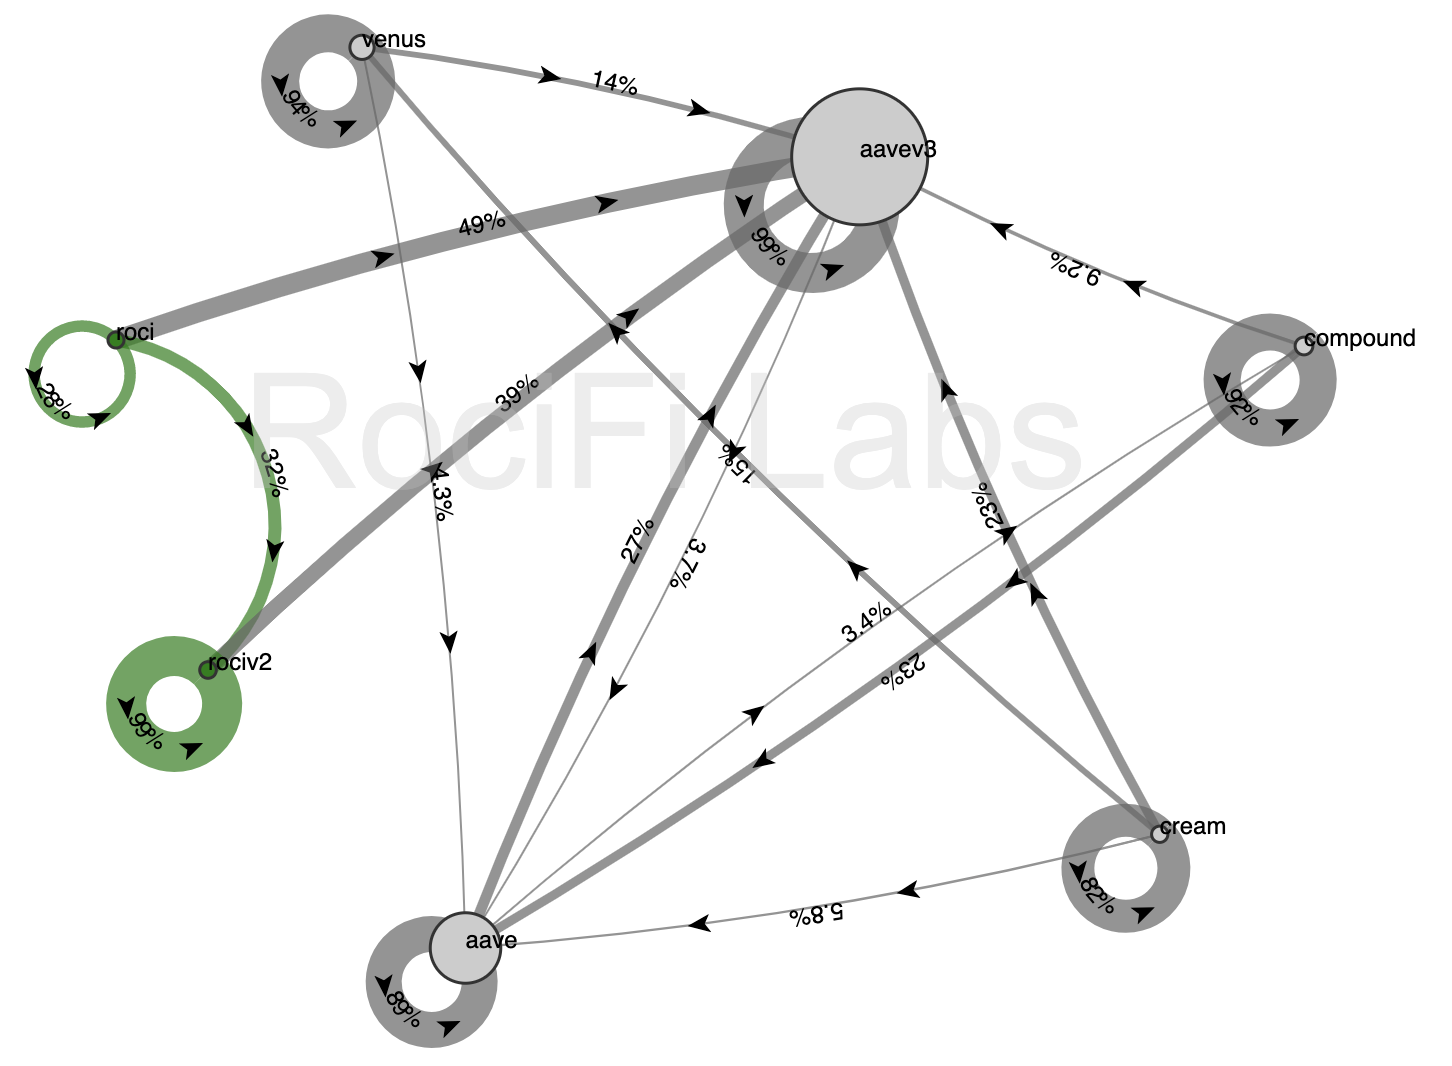
- Combinations of lending protocols in a wallet’s history of interactions.
As an extra tool for optimizing our own platform’s marketing campaigns, we also analyzed the Customer Journey Maps (CJMs) using the Retentioneering framework.
Gathering data: the challenges
- For each network (Ethereum, BNB Chain, Polygon…) and protocol (Aave, Compound, etc.), we had to write custom code for collecting data. It took a lot of browsing through documentation, searching on forums, and going through bugs.
- Transaction amounts had to be converted into USDT. This was far from a trivial task. We had to not only match the contract address (as it’s the address and not the token name that figures in transactions) with the asset and pull historical price data, but also procure information about the prices of low-cap tokens that aren’t traded on major DEXs.
- Huge data volume. For example, Ethereum processes around 1 million transactions daily, while Solana has already accumulated over 184 billion transactions since 2021.

As a result, we experienced the same challenges as with any Big Data system: optimizing data storage costs, speeding up processing and transformation, real-time updates to be able to react quickly (within 1 or 2 minutes) to changes in the market or user behavior, etc.
And yet, we managed to resolve these issues and set up data streaming in such a way that transaction details would enter database a few seconds after getting recorded on the blockchain.
🎯 The solution
Incentive to repay: NFCS
Undercollateralized borrowers don’t necessarily have an incentive to pay back the loan. For example, if you deposit 1,000 USDT as collateral and borrow 1,500 worth of USDT, you may decide to keep the ETH. Nobody can force you to repay, either, as the protocol doesn’t even know your name.
Therefore, one of tasks was to introduce additional motivation. We created a special indicator called NFCS (Non-Fungible Credit Score) — a token that is generated individually for each user and analyzes their interactions with lending protocols on various chains (Ethereum, BNB Chain, Polygon…).
The indicator is constantly updated, and only users with a high NFCS value can access undercollateralized loans. One’s NFCS also influences the borrowing interest rate.
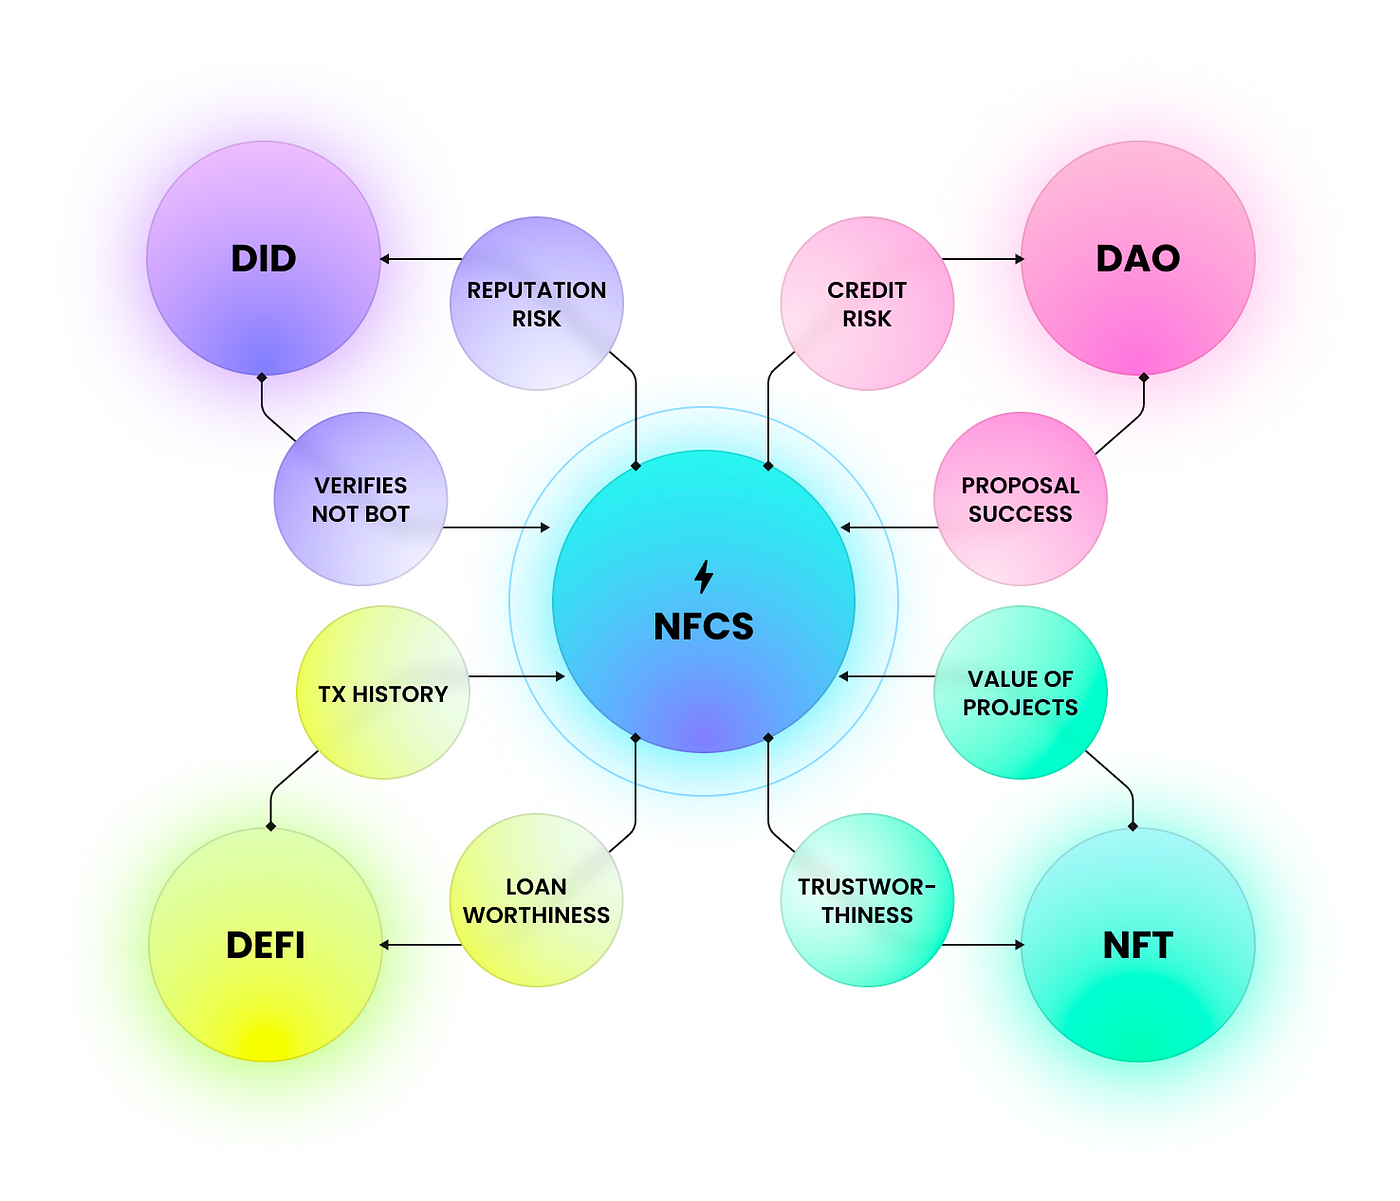
NFCS pulls data from several sources (protocols), which, in turn, can use NFCS value to validate the behavior of their users.
The model reacts to each wallet transaction by increasing or decreasing the NFCS rating. Thus, it’s in the borrower’s interest to repay loans on time in order to improve their credit history and borrow at a lower interest rate.
We’ve also established collaborations with other popular lending protocols so that they, too, use our scoring standard. If a user damages their NFCS while using RociFi Labs, these partner protocols won’t issue them a loan at a good interest rate, either. It’s almost like in TradFi, where banks can see if a user hasn’t repaid a loan issued by another institution.
Of course, a user can create a new wallet and use it to request a loan, but they would need to build a good borrowing history for that wallet first — and we made sure that this would take a lot of time and effort! 😈
🧠 ️ML approaches
Banks use ML models as a decision-making tool, but the final decision about a loan is taken by a human. Sure, some banks have started to eliminate humans from the procedure, but only once they have perfected their scoring models over a number of years.
We, by contrast, had to blast our own path into the unknown — without sufficient data or best practices for model training. Because of this, most of the time was spent on model validation, building a robust solution, and pre-release testing.
Cross-validation
Cross-validation was an important element of the process. We used a modification of PurgedGroupTimeSeriesSplit Cross-Validation, an algorithm that is popular in TradFi. It employs the walk-forward (WF) methodology, but data are split into groups and a gap is left between test and training folds to make sure they remain independent.
This approach allowed us to account for market dynamics. This is crucial in blockchain, as the situation changes all the time and a successful model needs to be able to react correctly to such changes. You can learn more about this validation method here, while the diagram below shows how data are split into sets.
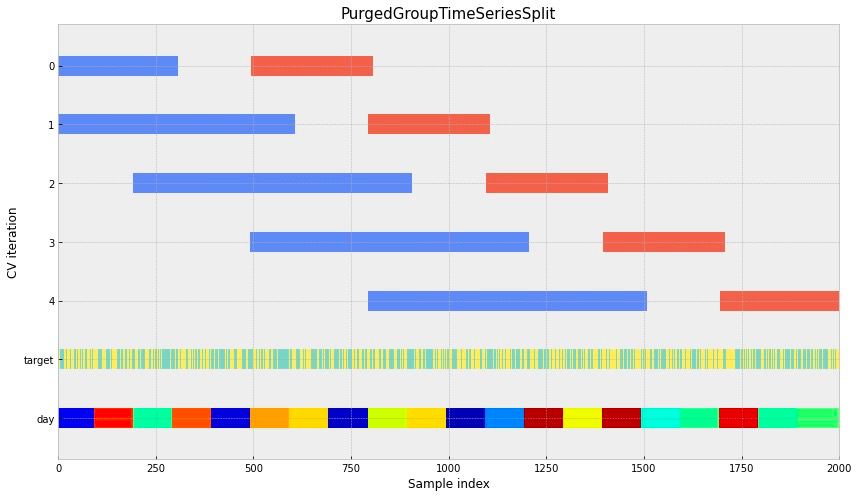
For an even fairer model evaluation, we temporarily removed outliers from the test fold and brought them back when using it for training. See more on this approach here and here. This page contains a repository with an implementation of similar cross-validation logic.
To improve feature selection, we mixed in noise from various distributions and removed the features that were statistically less relevant than the noise. We’d then make as many iterations as needed.
Hyper parameters
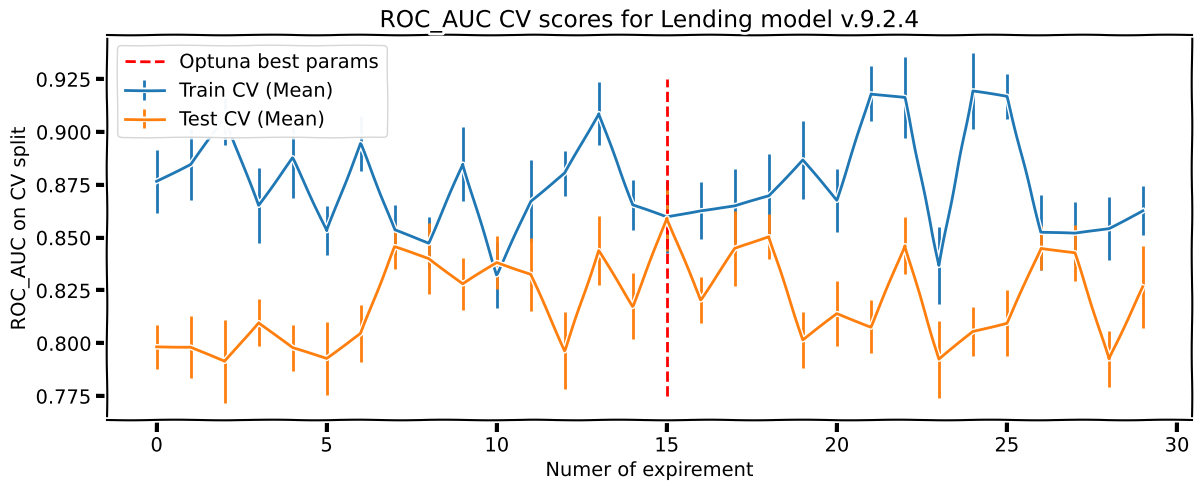
We used the Optuna library to select hyper parameters for the model. The best optimizer for our task turned out to be Tree-structured Parzen Estimator (TPE) and Hyperband as a pruning tool. The model was optimized by several criteria: we not only sought to improve the metrics for the testing sets but also kept an eye on the training sets’ metrics.
About the Tree-structured Parzen Estimator (TPE) and Pruning
The TPE** algorithm is iterative, just like that of Bayesian optimization. At each iteration, a decision is made on which hyper parameters should be kept for the next step based on the results of the preceding iteration. However, TPE differs from the Bayesian formula.
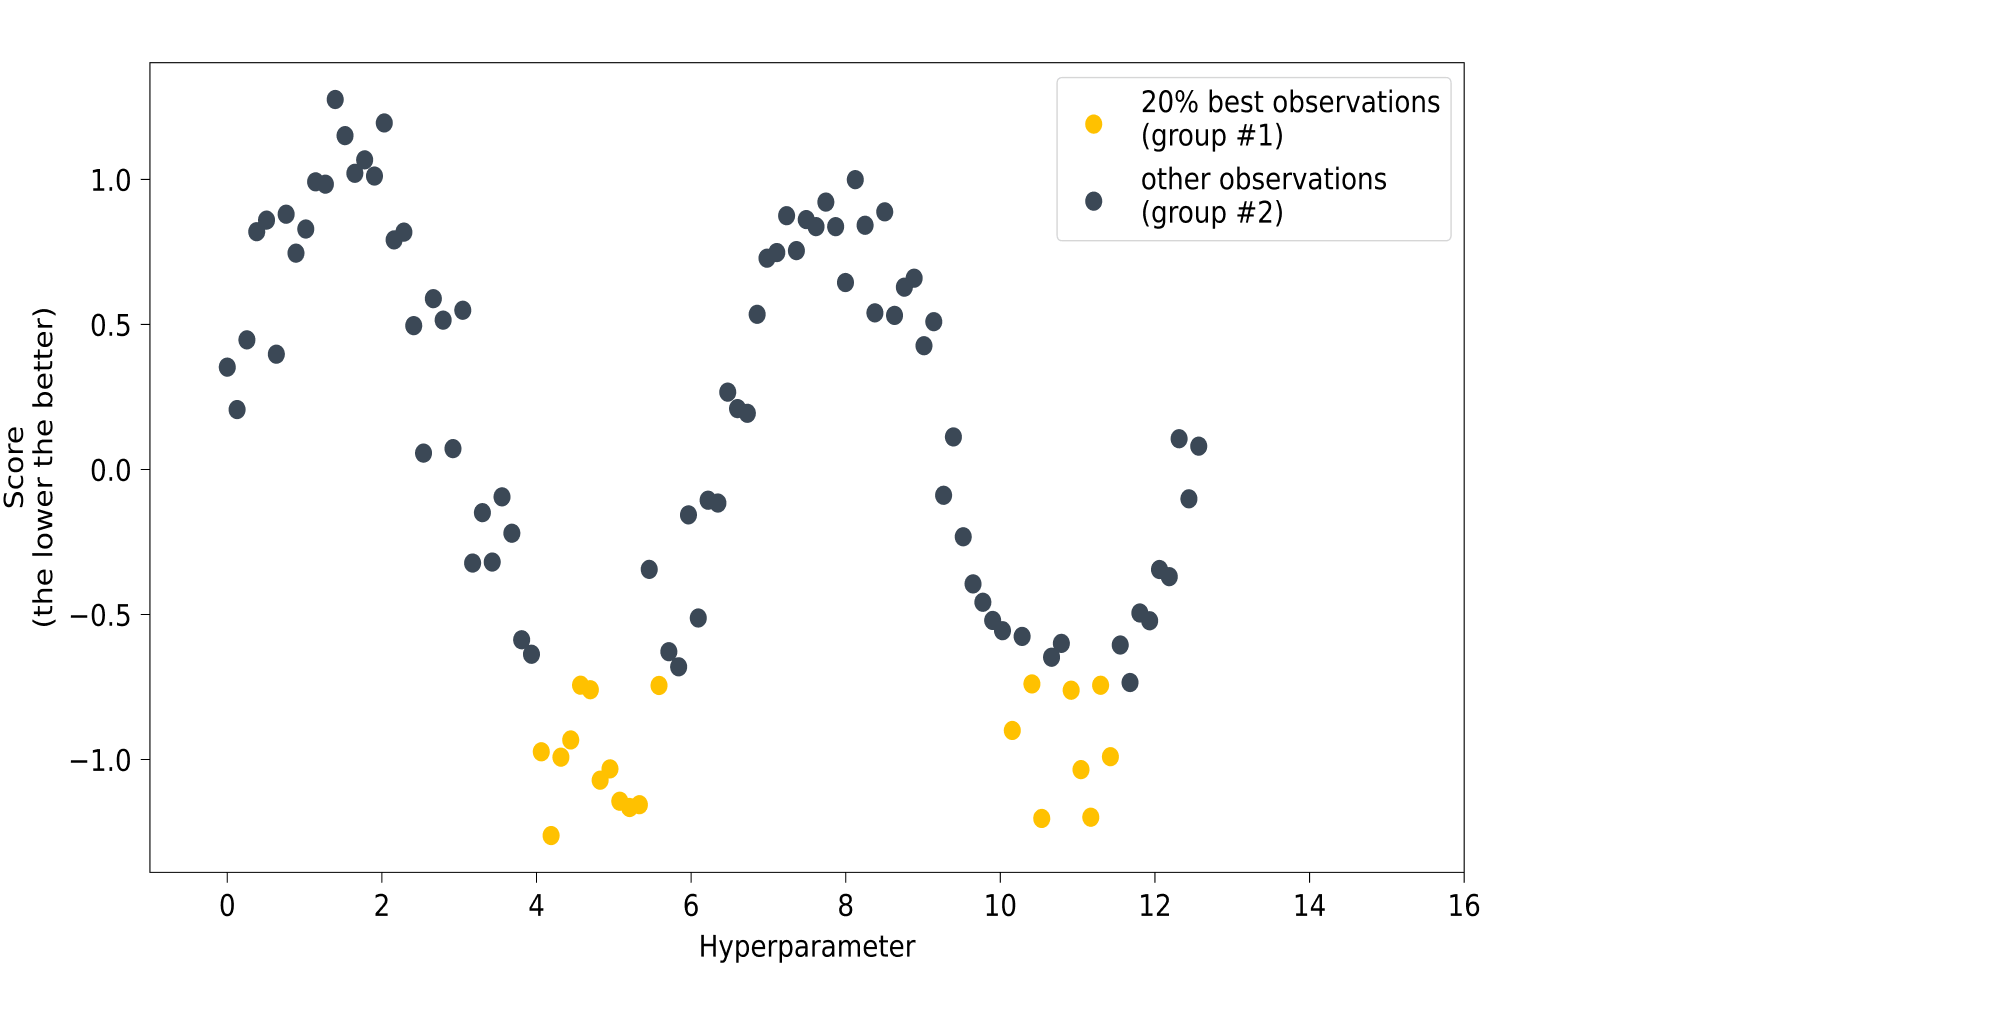
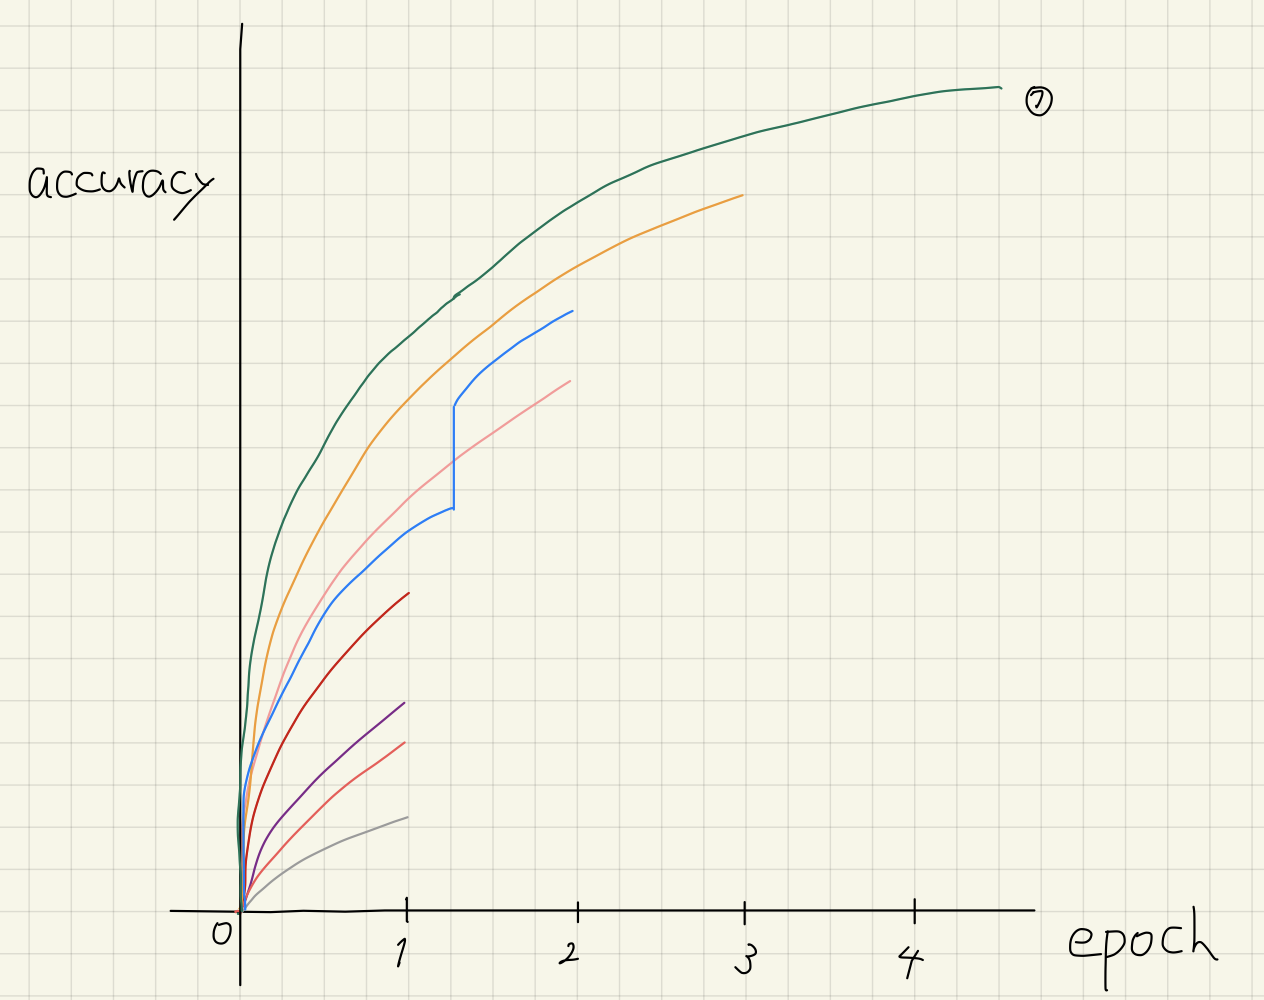
Let’s say we want to find the optimal value for a single hyper parameter. The first few iterations will serve as a warm-up for the algorithm: we need to get a group of parameter values for which the model’s quality is known. The easiest way to gather such values is to conduct a few Random Search iterations (where their number is set by the user).
The next step is to split the data collected during the warm-up into two groups: the observations for which the model produced the best results, and the rest. The share of the best observations is also set by the user: usually it’s 10–25% of the total, as shown in the picture:
Pruning is an algorithm that allows you to eliminate those experiments that are likely to lead to suboptimal results.
💡 Business logic and insights
Next we added a business logic module that allowed us to fine-tune the credit rating. For example, we modified the maximum possible NFCS score value depending on how many loans a user had previously taken out. We did the same with transaction volume and frequency as a way to filter out bots.
A couple of insights:
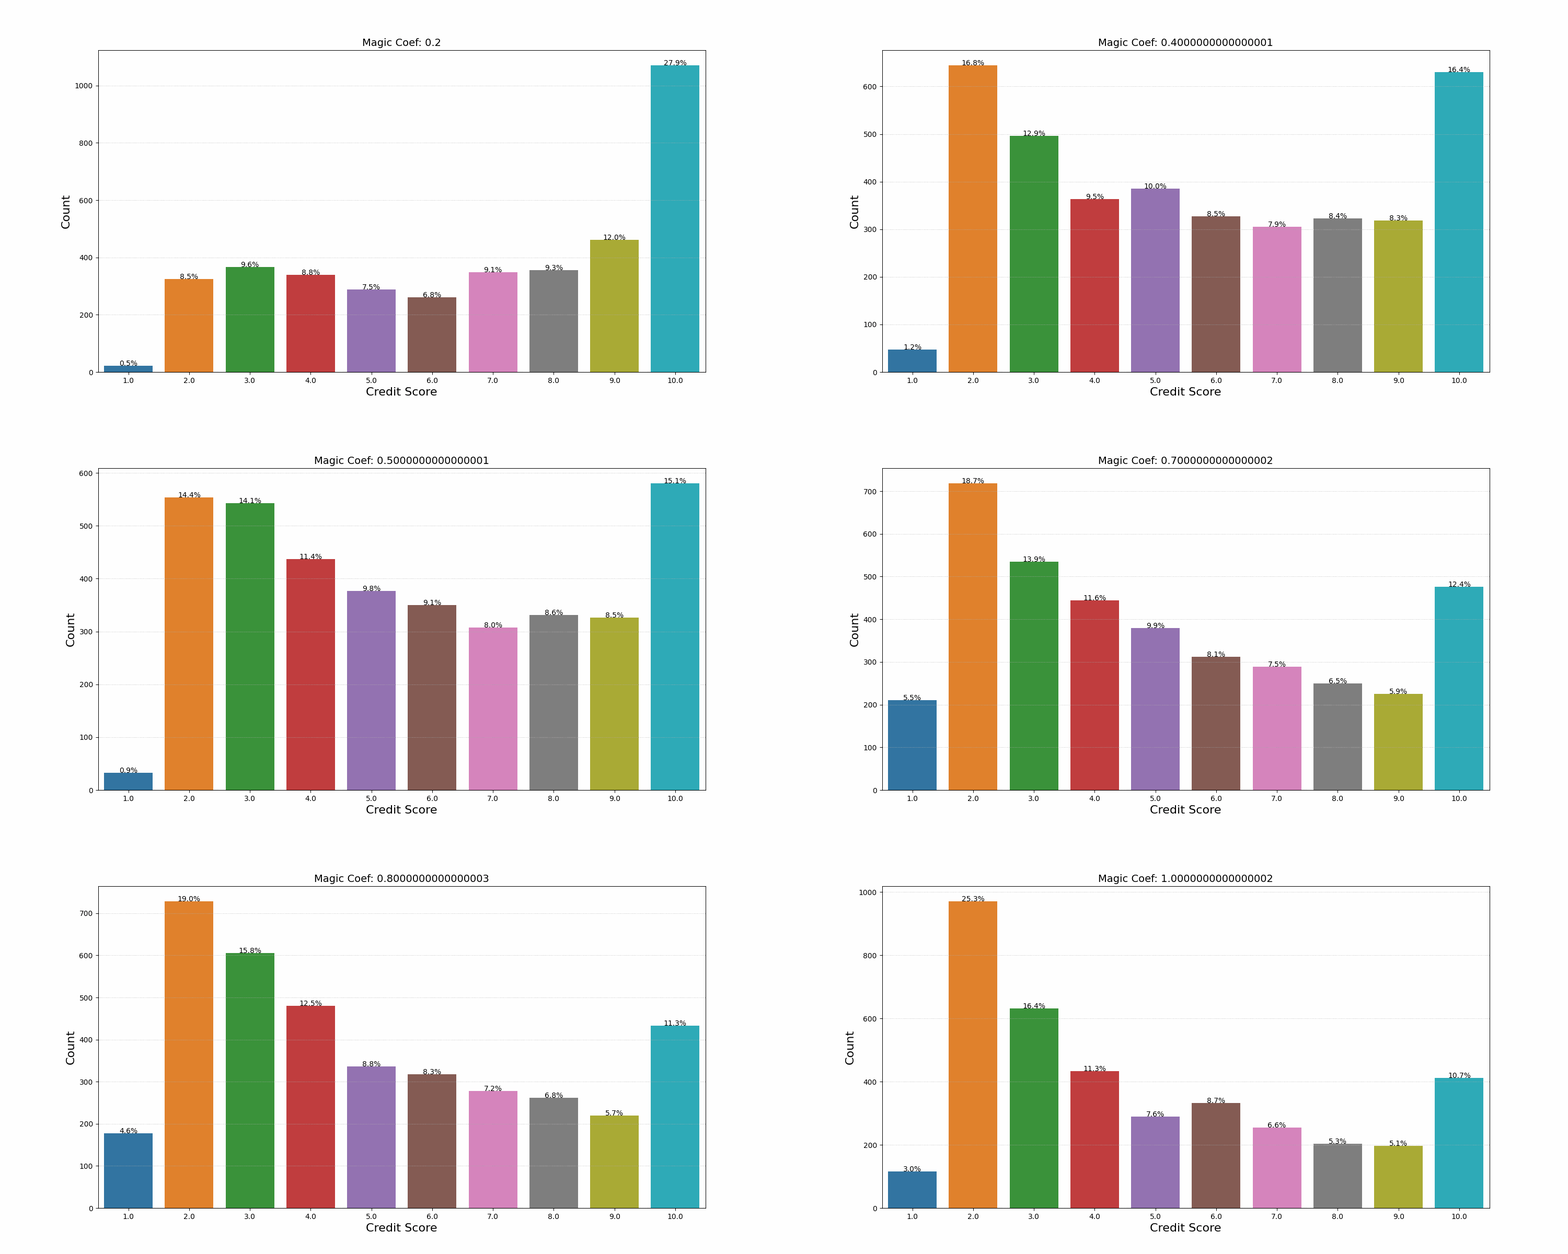
We noticed that the model would decrease the credit score starting from a certain number of repaid loans. It seemed counterintuitive at first, but then we realized that the model had found a less-than-obvious link between the number of loans and the risk that the user won’t repay in the future. After analyzing the data, we concluded that the model was right. We developed a coefficient that helped regulate how conservative the model’s final score distribution was. We even called it the Magic Coefficient (MAGIC_COEFF), and now it’s frequently used by our business development and marketing departments before launching new campaigns.
- Although DeFi lending doesn’t have a regulator that could demand an explanation for why a loan was issued to a specific user, we still conducted lots of trials focused on the model result interpretation. For this, we combined Lime and Shap, as well as removed interdependent features during trials. This was important to our users, who often asked why they had received this or that score value — but it was also important to us, as we wanted to understand how the model works on a deeper level. After all, it was the platform’s own money that was given out as loans, so the cost of every mistake was quite high.
- We also invested a lot of time into creating unique features that could improve the model’s quality. While the NDA doesn’t allow me to disclose the list, I can share an example:

🤖 Bot detection
As it turned out, detecting a bot isn’t all that difficult. As we looked through transaction history, we found several behavior patterns shared by multi-accounters (users who created multiple wallets).
The difficulty lay in the fact that we needed to process vast volumes of data from different blockchains, and storing it all was very expensive. However, we did find a solution — which even gave rise to a new business vertical for RociFi Labs: Ra, an omnichain wallet analytics platform for Web3 finance and marketing.
The second issue was dataset markup. To create it, we first drew up a list of patterns that point to a bot: for example, sending transactions with non-round values to the same address after set intervals; large volumes combined with small individual transaction values; preference for new or previously unused addresses, etc.
For instance, here is a bot that always sends the same number of transactions; and here is another one that sends transactions in batches.
Our innovation lay in the second step: we calculated the percentage of these bot indicators that each wallet matched and added weights based on our expert knowledge. As a result, we obtained a marked dataset that could be used to train the ML model using the approaches I’ve described earlier.
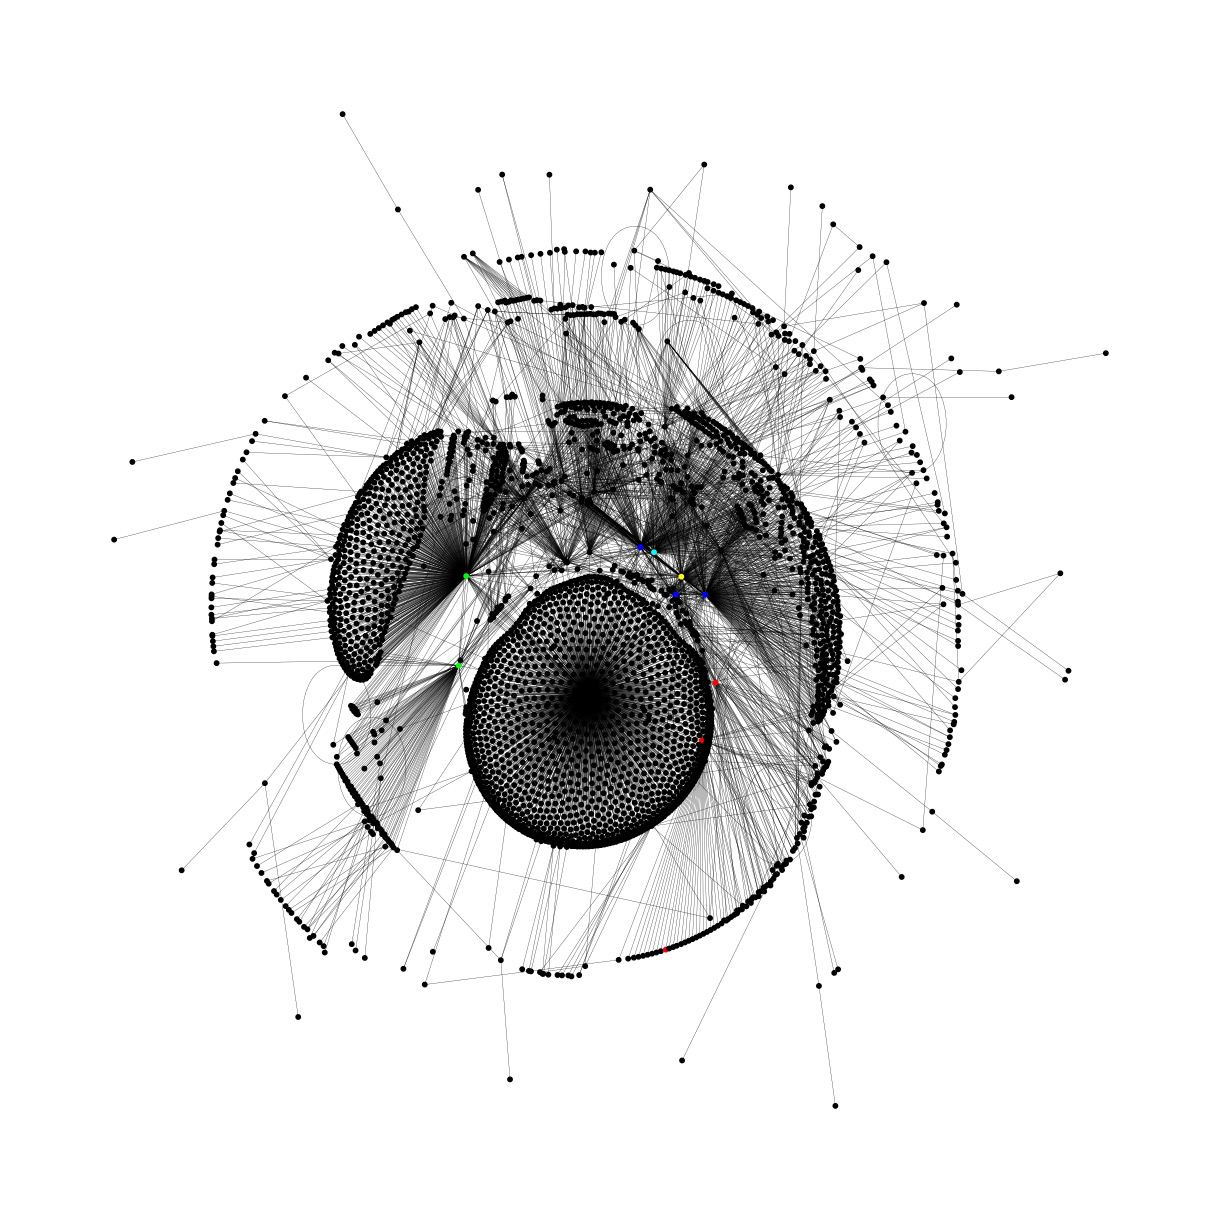
We also used Relational Graph Convolutional Networks (R-GCNs) to identify linked wallets. For this, we compiled a full list of interactions that included not just transaction data but also account data, transaction history, etc. This made it more difficult for dishonest users to hide their malicious behavior. We managed to detect patterns like node aggregation, where a user acts in cahoots with a network of “collaborators”; and activity aggregation, where a wave of suspicious transactions suddenly occurs. You can read more about this approach in this blog post.
Competition
I should also mention our potential competitors who are working on the same challenge of minimizing undercollateralized loan risks:
- Spectral: using a similar approach to AI credit scoring, the project created its own approach called MACRO Score (more info in the blog).
- Cred Protocol: scalable decentralized credit scoring for Web3.
- ReputeX: this platform doesn’t issue loans but rather calculates a reputation score that can be integrated into dApps.
- DECO by Chainlink: a privacy-preserving oracle for verifying the reliability of a borrower.
Results
AI scoring system is already being used by RociFi Labs, helping to reduce the risks of undercollateralized loans. Our solution is quite complex and includes several elements:
- Bot detection;
- Protection against fraud and bots;
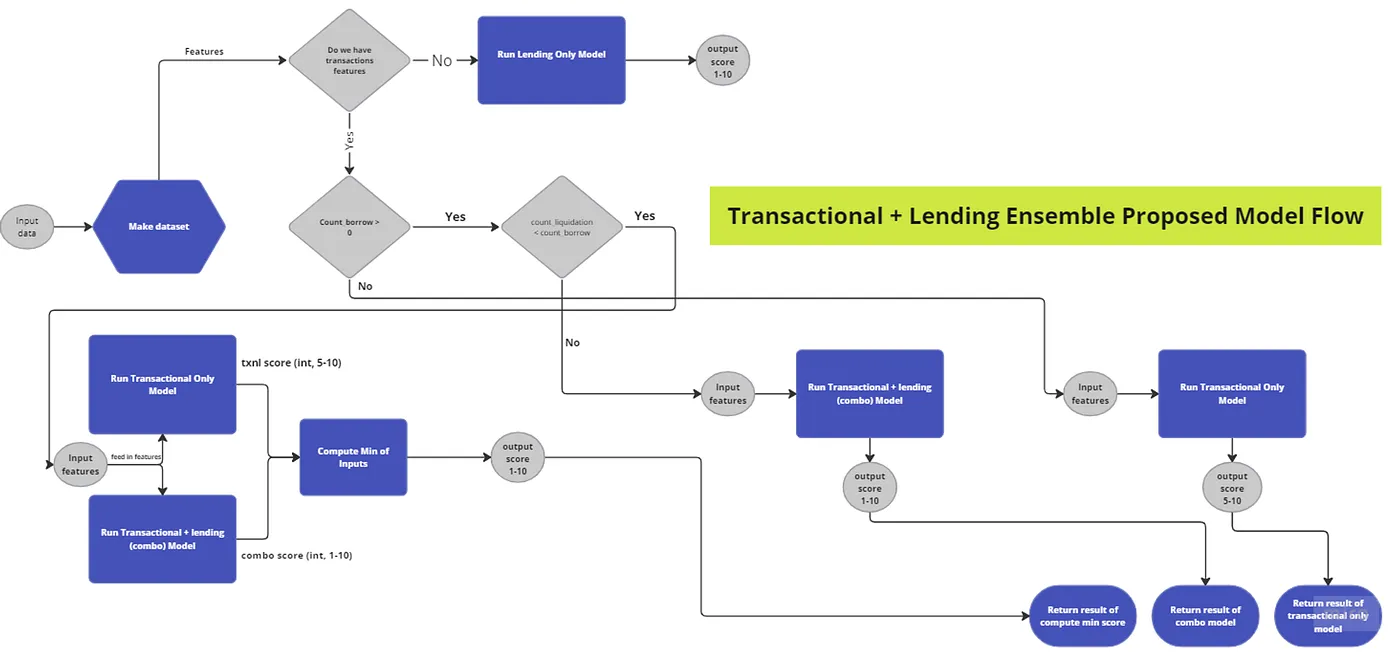
- Ensemble models on different levels of abstraction. We went even further and learned to predict the credit score for users who have never borrowed money in DeFi. Without actual loan data, the model produced less reliable results, so we created an ensemble model combining several approaches.
Our ML model in numbers
- ROC AUC precision metric: 0.85 ± 0.02;
- Number of supported blockchains: 14;
- Time needed to process and store a transaction once it appears on the blockchain: ~5 seconds;
- Total value of issued loans: ~175k USD*;
- Total data: ~5 TB;
- Time needed to generate model parameters from raw data: ~8 hours;
- Full training and deployment cycle: 20 minutes. You can find more detailed statistics on Dune.
Like any innovative system, AI scoring model sometimes makes mistakes, causing minor financial losses for the protocols. The challenge of repayment incentives is yet to be fully resolved, too. However, the fact that such an efficient ML model was built in such a short time is in itself a victory for machine learning in blockchain. It’s proof that AI isn’t just a narrative but a crucial future part of Web3.